Where Is California Housing Growth Happening in 2026?

California's housing market looks different depending on where you look.
Some cities add thousands of housing units each year, while smaller counties can experience faster growth relative to their existing housing stock.
Understanding these differences provides a useful perspective on California's changing residential landscape.
According to the California Department of Finance's May 2026 housing estimates, Los Angeles recorded the largest net increase in housing units among California cities between January 1, 2025, and January 1, 2026. San Diego and Sacramento followed.
But the biggest cities were not the only places experiencing significant growth. Yuba, Madera, and Del Norte counties recorded some of the state's fastest housing-stock growth rates.
This report examines where California added the most housing units, which counties grew fastest, and how single-family and multifamily housing contributed to the changes.
Key findings
- Los Angeles led California cities with a net gain of 11,260 housing units.
- San Diego added 8,635 units, followed by Sacramento with 5,048.
- The three leading cities recorded a combined net gain of 24,943 housing units.
- Yuba County had the state's highest housing-stock growth rate, at 2.32%.
- California added 115,165 housing units on a net basis in 2025.
- Statewide housing-stock growth slowed from 0.84% in 2024 to 0.77% in 2025.
The findings are based on the California Department of Finance's 2026 housing estimates.
Which California Cities Added the Most Housing Units?
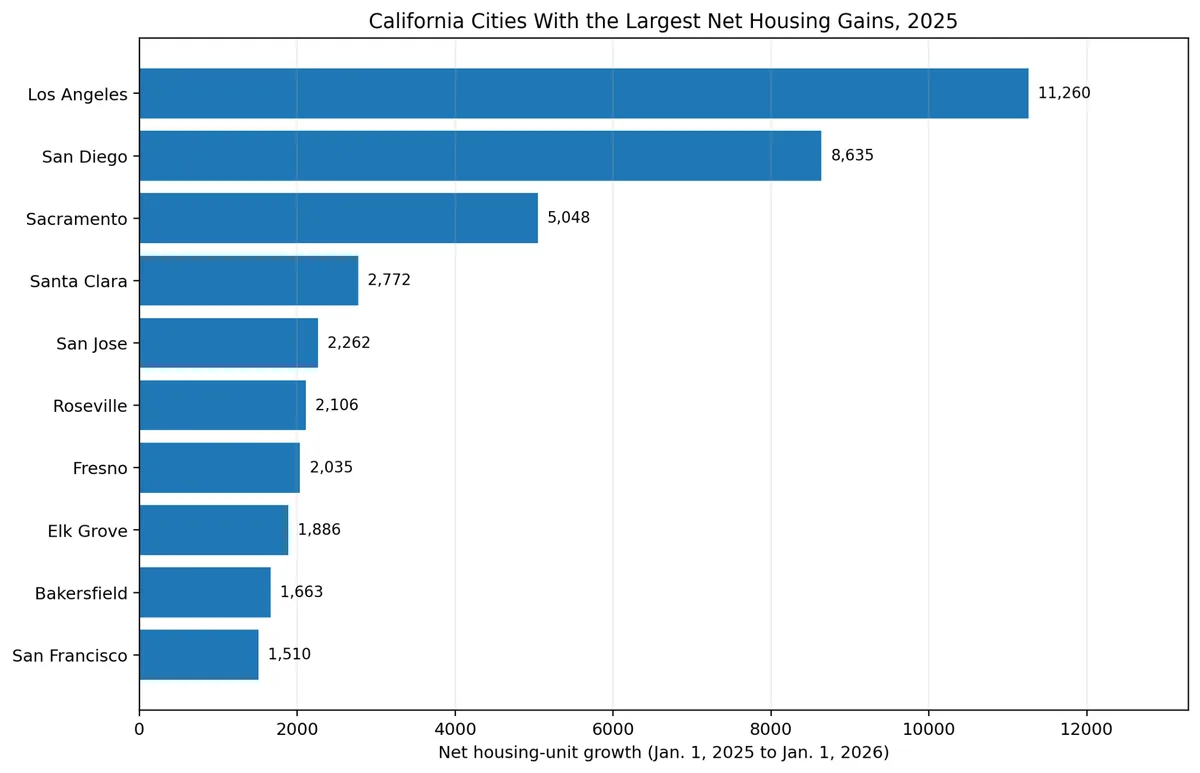
Los Angeles recorded the largest net increase in housing units in 2025, adding 11,260 units.
San Diego ranked second with 8,635 units, while Sacramento placed third with 5,048.
The top 10 cities were:
| Rank | City | County | Net housing-unit growth |
|---|---|---|---|
| 1 | Los Angeles | Los Angeles | 11,260 |
| 2 | San Diego | San Diego | 8,635 |
| 3 | Sacramento | Sacramento | 5,048 |
| 4 | Santa Clara | Santa Clara | 2,772 |
| 5 | San Jose | Santa Clara | 2,262 |
| 6 | Roseville | Placer | 2,106 |
| 7 | Fresno | Fresno | 2,035 |
| 8 | Elk Grove | Sacramento | 1,886 |
| 9 | Bakersfield | Kern | 1,663 |
| 10 | San Francisco | San Francisco | 1,510 |
Source: California Department of Finance, E-1 Population and Housing Estimates, May 2026.
Los Angeles added 2,625 more housing units than San Diego, the second-ranked city.
The difference illustrates how much housing growth can vary between California's major urban centers.
Sacramento's third-place ranking is also notable. Its net increase of 5,048 housing units exceeded the combined totals of several cities further down the ranking.
These figures measure net housing-unit growth rather than building permits or new construction alone. They therefore provide a broader view of changes to the housing stock.
Which California Counties Have the Fastest Housing Growth?
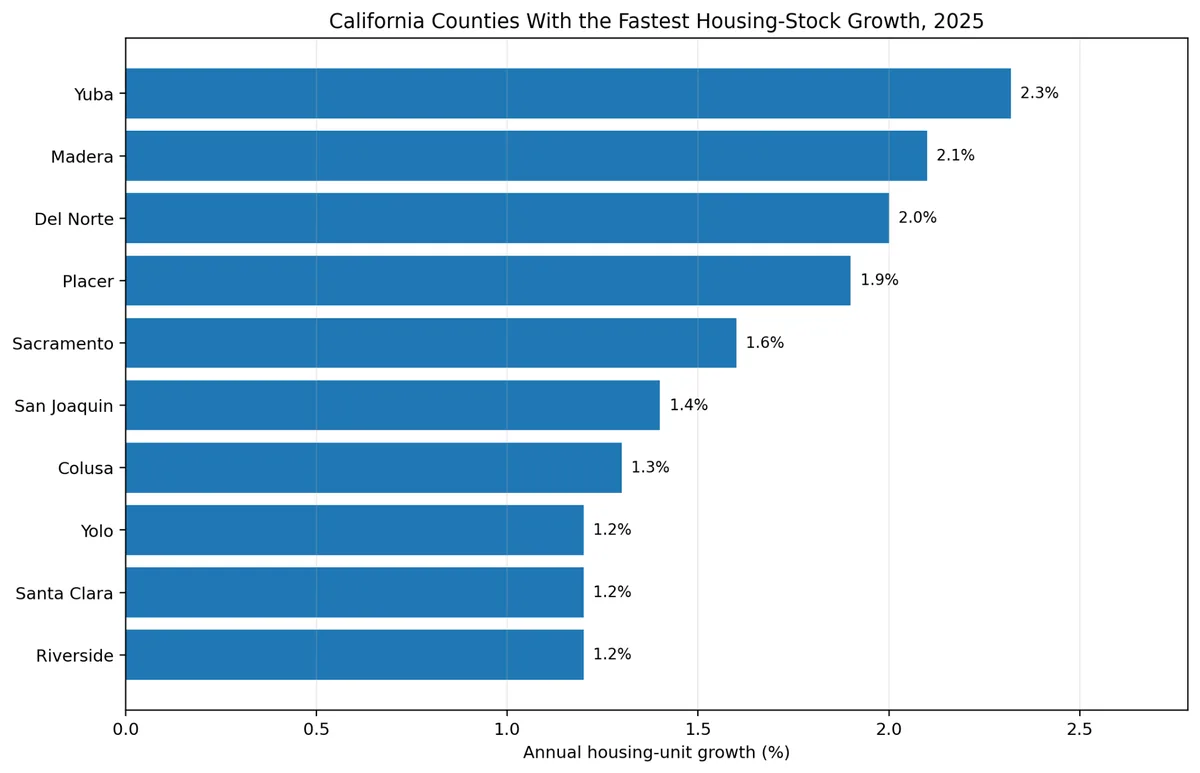
Absolute housing growth favors places with large populations and existing housing stocks. Percentage growth offers another way to compare locations.
Yuba County recorded California's highest housing-stock growth rate in 2025, at 2.32%.
Madera County followed at 2.10%, while Del Norte County recorded 2.00%.
| Rank | County | Housing-stock growth |
|---|---|---|
| 1 | Yuba | 2.32% |
| 2 | Madera | 2.10% |
| 3 | Del Norte | 2.00% |
| 4 | Placer | 1.90% |
| 5 | Sacramento | 1.60% |
| 6 | San Joaquin | 1.40% |
| 7 | Colusa | 1.30% |
| 8 | Riverside | 1.20% |
| 9 | Santa Clara | 1.20% |
| 10 | Yolo | 1.20% |
Source: California Department of Finance, E-1 Population and Housing Estimates, May 2026. Rates are rounded as published.
The contrast between the city and county rankings is important.
Los Angeles recorded the largest absolute net gain among cities, but Yuba County had the fastest housing-stock growth rate among counties.
A high percentage growth rate does not necessarily mean a location added the most homes. Smaller housing markets can experience substantial percentage changes from relatively modest additions.
For that reason, both the number of units added and the percentage change are useful when examining California's residential construction landscape.
Single-Family vs. Multifamily Housing: What the Data Shows
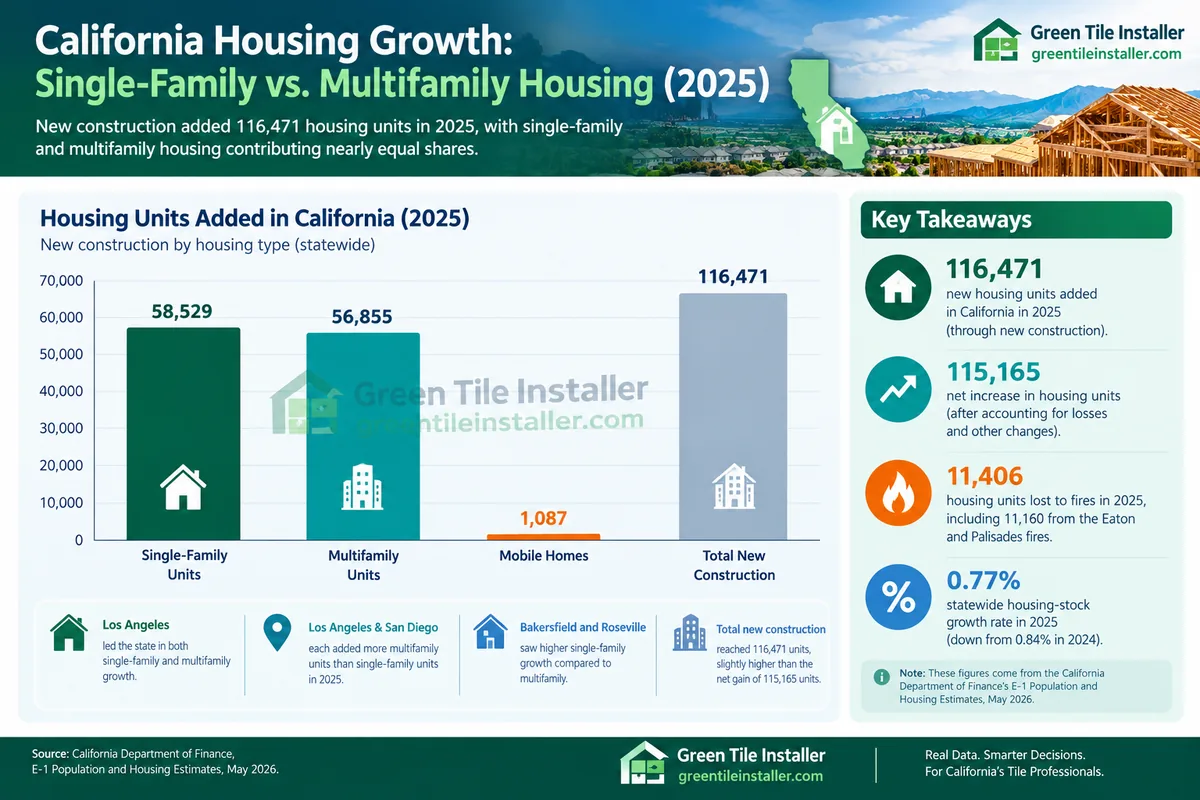
California's housing growth also differs by housing type.
The Department of Finance reported that new construction added 58,529 single-family housing units and 56,855 multifamily housing units in 2025, alongside 1,087 mobile homes.
That means single-family and multifamily construction contributed similar numbers of units statewide.
However, the balance varied considerably between cities.
Los Angeles recorded the largest net increase in both single-family housing and multifamily housing.
Its multifamily housing-unit growth reached 7,061 units, compared with 4,266 single-family units.
San Diego followed with 6,179 multifamily units and 2,456 single-family units.
Sacramento ranked third in both categories, recording 3,282 multifamily units and 1,766 single-family units.
Other cities showed a different pattern. Bakersfield recorded 1,432 single-family housing units in its category-specific ranking, while Roseville added 1,151.
These differences show why statewide totals alone cannot fully describe California's housing market.
Some cities experience substantial multifamily growth, while other markets see a larger contribution from single-family construction.
For home improvement and building-material businesses, the distinction matters because different housing types can involve different construction methods, project sizes, and finishing requirements.
Nevertheless, these statistics do not directly measure spending on tile, flooring, or other interior finishes.
California Added More Than 115,000 Housing Units on a Net Basis
California recorded a net increase of 115,165 housing units in 2025, bringing the state's total housing stock to 15,064,131 units.
Despite that addition, the statewide housing-stock growth rate slowed from 0.84% in 2024 to 0.77% in 2025.
The difference between new construction and net housing growth is particularly important.
New construction added 116,471 units during the year. The net increase was lower because the housing stock also experienced losses and other adjustments.
The Department of Finance reported that 11,406 housing units were lost to fires in 2025, including 11,160 associated with the Eaton and Palisades fires.
Consequently, simply counting newly constructed units does not tell the entire story of how California's housing stock changes.
For policymakers, builders, and housing researchers, net growth offers a broader measure of the resulting housing stock.
For construction businesses, new construction figures can be useful when assessing potential building activity, but neither measure guarantees demand for a specific trade.
What These Findings Mean for California's Construction Market
The data reveal three distinct patterns.
First, California's largest cities account for substantial absolute increases in housing units. Los Angeles, San Diego, and Sacramento lead the city ranking.
Second, some smaller counties are growing faster relative to their existing housing stocks. Yuba, Madera, and Del Norte stand out in the percentage-growth ranking.
Third, single-family and multifamily housing contribute differently across locations.
These distinctions can help construction companies, suppliers, real estate professionals, and housing researchers understand where residential development is changing.
They can also help identify questions for further investigation.
For example, a more detailed study could compare housing-unit growth with contractor establishment counts, population changes, housing affordability, and construction permits.
Such a comparison could help identify locations where construction activity and contractor availability appear misaligned. It would not, on its own, establish a shortage of contractors or prove unmet demand.
For businesses operating in residential construction, these additional indicators could provide a more complete picture of local market conditions.
Methodology and Sources
This report uses the California Department of Finance's E-1 Population Estimates for Cities, Counties and the State with Annual Percent Change, January 1, 2025 and 2026, released in May 2026.
The report provides annual housing estimates for California cities, counties, and the state.
The city rankings presented here measure net housing-unit growth between January 1, 2025, and January 1, 2026. County rankings use the housing-stock growth rates reported by the Department of Finance.
Single-family and multifamily figures are taken from the report's housing-type breakdowns.
These estimates should not be confused with the number of building permits issued or the total number of newly constructed homes. The Department of Finance's housing estimates account for changes in housing stock, while the Census Bureau's Building Permits Survey measures housing units authorized by permits.
The data are subject to the methodologies and revisions described by the source agencies.
Primary source: California Department of Finance: 2026 housing estimates.
Supplementary source: U.S. Census Bureau: Building Permits Survey.
The research dataset behind this report is a curated compilation of 43 rows covering the city rankings, housing-type rankings, county growth rates, and statewide figures, drawn from published Department of Finance rankings and summary figures. It is not the complete raw dataset for every California city and county.